Cyclistic Case Study 3
This is a case study in the Capstone Projects Course which is the last step of Google's Data Analytics Professional Certificate. I have previously completed this case study with sample datasets using R and Google Spreadsheets, SQL, and Tableau. This time I wanted to get experience with Big Data. This project involves analyzing a large dataset with nearly 6,000,000 rows of data. I used R programming and various data analysis techniques to explore the dataset, identify trends, and create insightful visualizations. Also, I update the course guide in the R book because some of them don't work anymore. Check the updated version.
Scenario: I am a junior data analyst working in the marketing analytics team at Cyclistic, a bike-share company in Chicago. The director of marketing believes the company’s future success depends on maximizing the number of annual memberships.
The company has 3 pricing plans which these are:
- Single-ride passes
- Full-day passes
- Annual memberships
Customers who purchase single-ride or full-day passes are referred to as casual riders. Customers who purchase annual memberships are Cyclistic members. If you are a course student and want to see the SQL process, you can visit my other projects.
If you are a course student and want to see detailed processes of Spreadsheets you can visit my blog. Also, you can visit my blog content, which addresses the other most common question that was “Is it normal to get stuck during the first data project?”
Data were obtained directly from company records available at:
https://divvy-tripdata.s3.amazonaws.com/index.html
License to use data is available at:
https://www.divvybikes.com/data-license-agreement
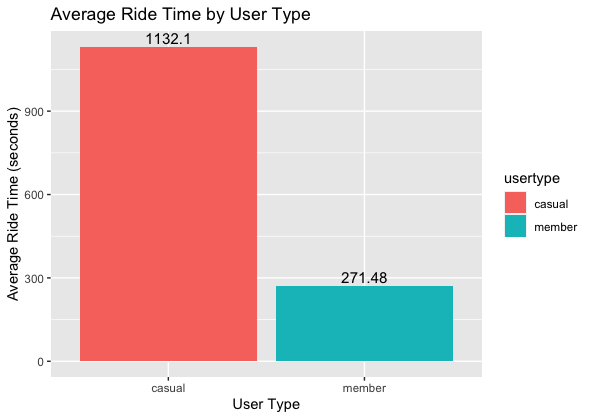
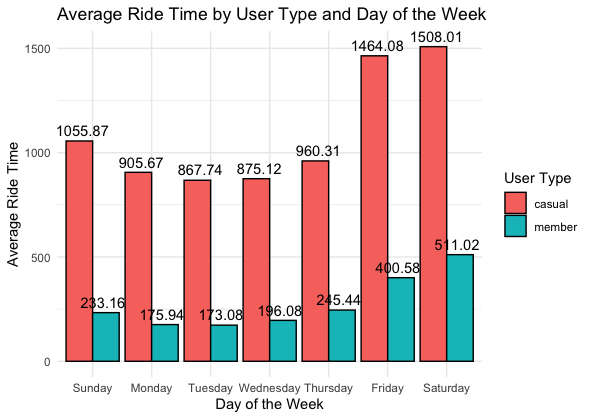
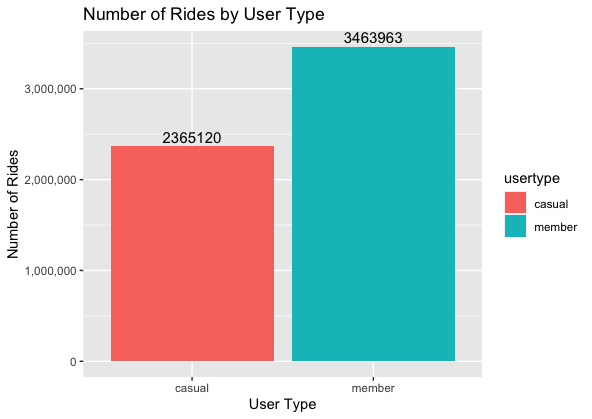
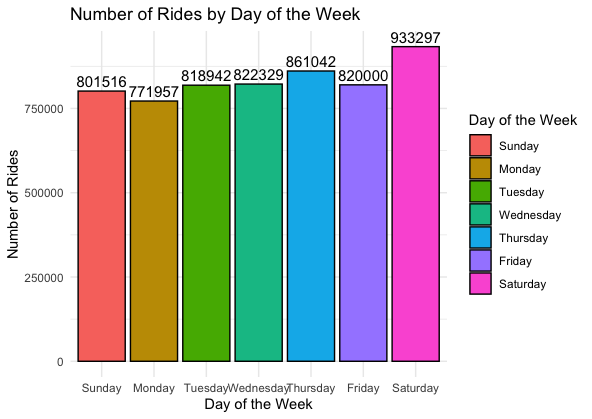
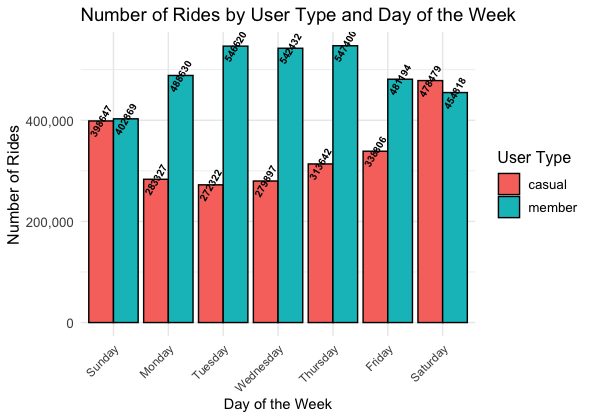
Project Highlights in Visualizations:
Additionally, you can visit my other presentations with the sample datasets here:
Google Slides Tableau