Google Data Analytics Capstone Project
Published on April 10, 2023
“Congratulations! Completing an online course is no simple endeavor. It requires time, dedication, and commitment, so when we say "Congratulations" - We mean it! “
My favorite time of the course is when I receive this notification because it is so true!
You have finished all 7 courses in the Google Data Analytics Certificate Course and have reached the last part of the course, which is the Google Data Analytics Capstone Project. I can imagine how much effort you have put in so far, and I am also excited about this step. However, you may have realized that the Cyclistic data did not open in spreadsheets. You can change your case study or use something else. But if you want to practice your spreadsheet skills on this dataset, you can follow my process.
I will try to answer the most common questions that I encountered while doing my project. I will share my project steps and the tips that I learned to help you in your case study process because the data community shares an amazing supporter vibe like no other community! That's why I am encouraged to share my process because I couldn't find these answers, and I know many people will search for them.
Also, you can visit my blog content, which addresses the other most common question that was “Is it normal to get stuck during the first data project?”. Actually, I thought I would share the answer to this question as part of this content, but it transformed itself into something else and deserves a place of its own. So, I decided to share this part separately. You can read it here
You will find the original datasets, sample size datasets, and the R codes in the files here.
Also, if you want to view the results of this study, you can view my presentation here.
This is a case study in the Capstone Projects Course, which is the last step of Google's Data Analytics Professional Certificate.
Scenario:
I am a junior data analyst working in the marketing analyst team at Cyclistic, a bike-share company in Chicago. The director of marketing believes the company's future success depends on maximizing the number of annual memberships.
The company has 3 pricing plans which these are:
- Single-ride passes
- Full-day passes
- Annual memberships.
- Customers who purchase single-ride or full-day passes are referred to as casual riders.
- Customers who purchase annual memberships are Cyclistic members.
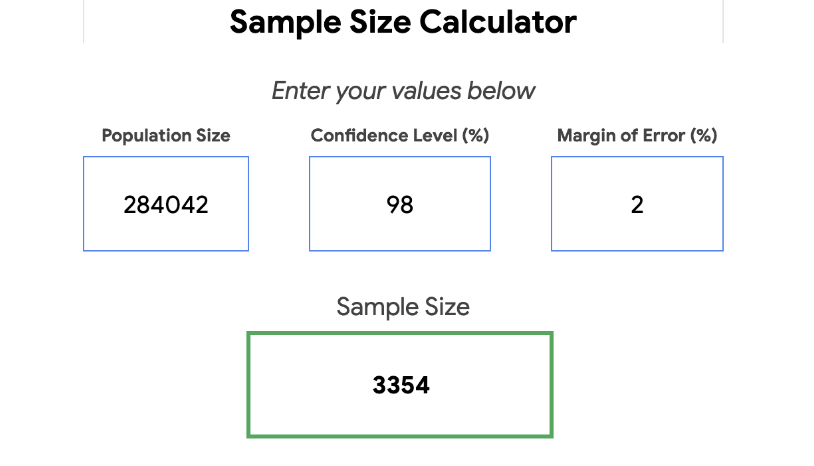
In this case study, I prefer to use spreadsheets, R, and Google Slides. Unfortunately, the company's data was too big for the spreadsheet, so I decided to choose a sample dataset and work on it. The dataset has a 98% confidence level and a 2% margin of error level. Sample sizes were chosen depending on the Sample Size Calculator Sheet shared in the course content.
Why couldn't Cyclistic data be opened on Google Spreadsheet?
Google Sheets can process up to 18,278 columns, and the upper limit for rows is 40,000. However, Cyclistic's datasets have almost 300,000 rows. Therefore, Cyclistic's data will be too big to work on a spreadsheet.
How can I work on a spreadsheet with this Cyclistic case study?
I also realized that the dataset was too big to work on a spreadsheet. So, you can choose a convenient sample and create sample datasets to work on. I chose samples with a 98% confidence level and a 2% margin of error depending on the Sample Size Calculator Sheet shared in the course content.
Step 1: Check the Cyclistic data row numbers.
install.packages("tidyverse")
library(tidyverse)
install.packages("readr")
library(readr)
read.csv("/cloud/project/cyclistic_case_study/cyclistic_data/2022-03_trip_data/202203-divvy-tripdata_original.csv")
march_2022 <- read.csv("/cloud/project/cyclistic_case_study/cyclistic_data/2022-03_trip_data/202203-divvy-tripdata_original.csv")
nrow(march_2022)
Step 2: Set the correct sample depending on the row numbers.
I used the Sample Size Calculator Sheet shared in the course content, but unfortunately, I cannot share it due to ethical and legal issues. However, you can find another calculator on the web.
Step 3: Choosing samples and saving new datasets with R functions.
install.packages("tidyverse")
library(tidyverse)
install.packages("readr")
library(readr)
read.csv("/cloud/project/cyclistic_case_study/cyclistic_data/2022-03_trip_data/202203-divvy-tripdata_original.csv")
march_2022 <- read.csv("/cloud/project/cyclistic_case_study/cyclistic_data/2022-03_trip_data/202203-divvy-tripdata_original.csv")
nrow(march_2022)
install.packages("dplyr")
library(dplyr)
sample_march_2022 <- sample_n(march_2022, 3354)
View(sample_march_2022)
write.csv(sample_march_2022, file = "sample_march_2022.csv", row.names = FALSE)
Note: Use row.names = FALSE otherwise row numbers also include your exported file. Also, I include null cells because I wanna practice to spreadsheet cleaning.
Note: I upload all my code chunks and dataset samples to GitHub you can reach them here.
Step 4: Repeat these steps for all 12 datasets.
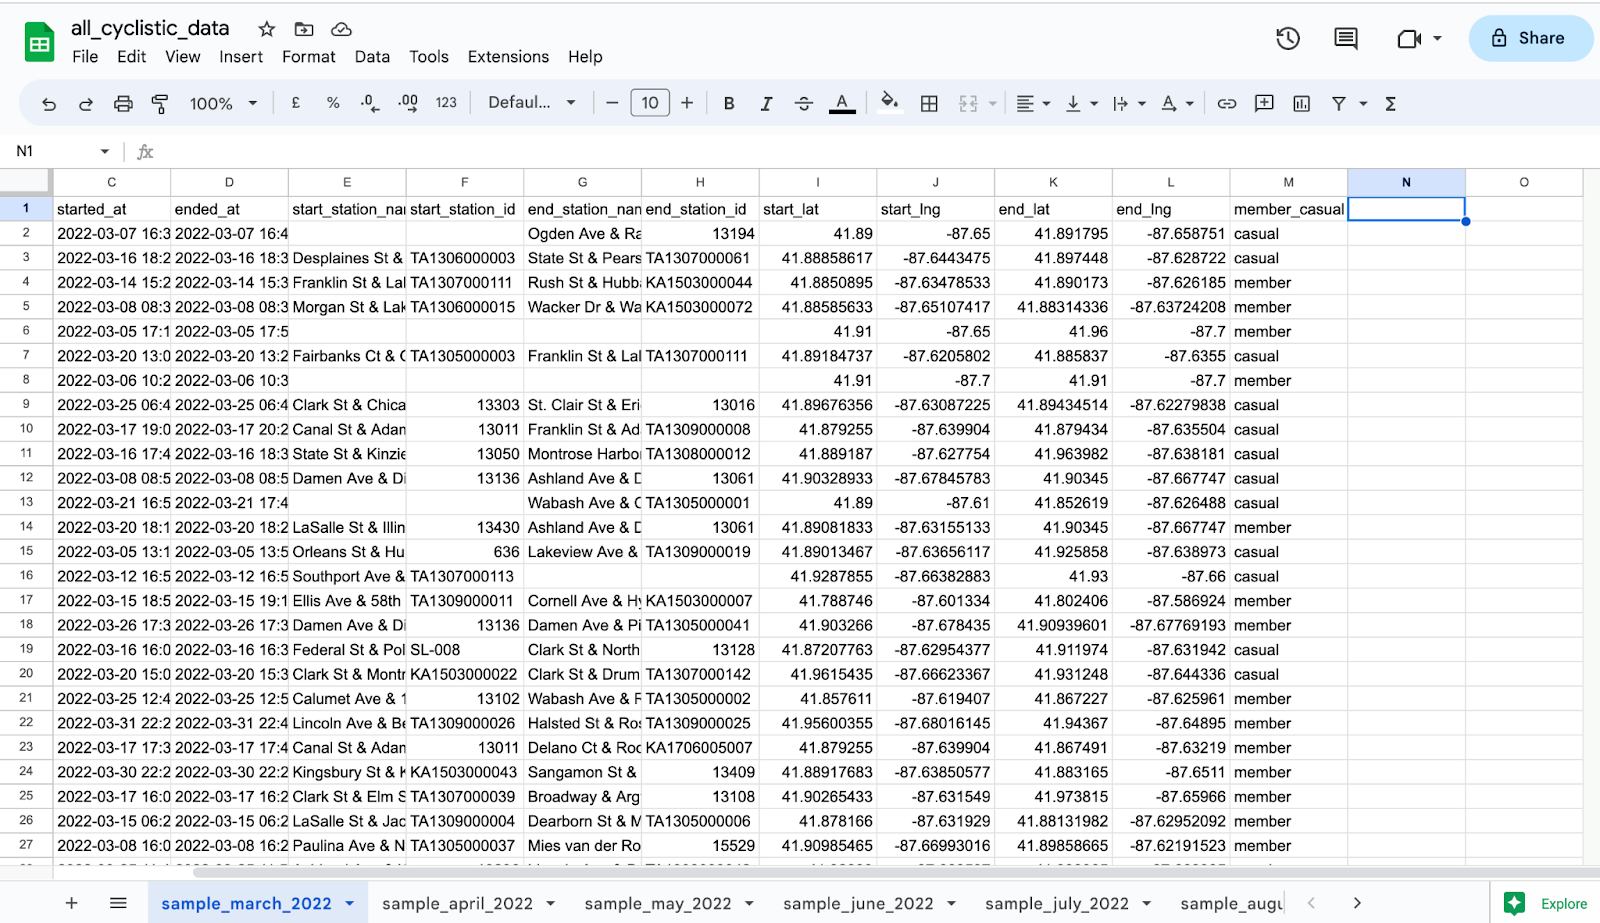
Step 5: Import all data and unite all spreadsheets in one spreadsheet.
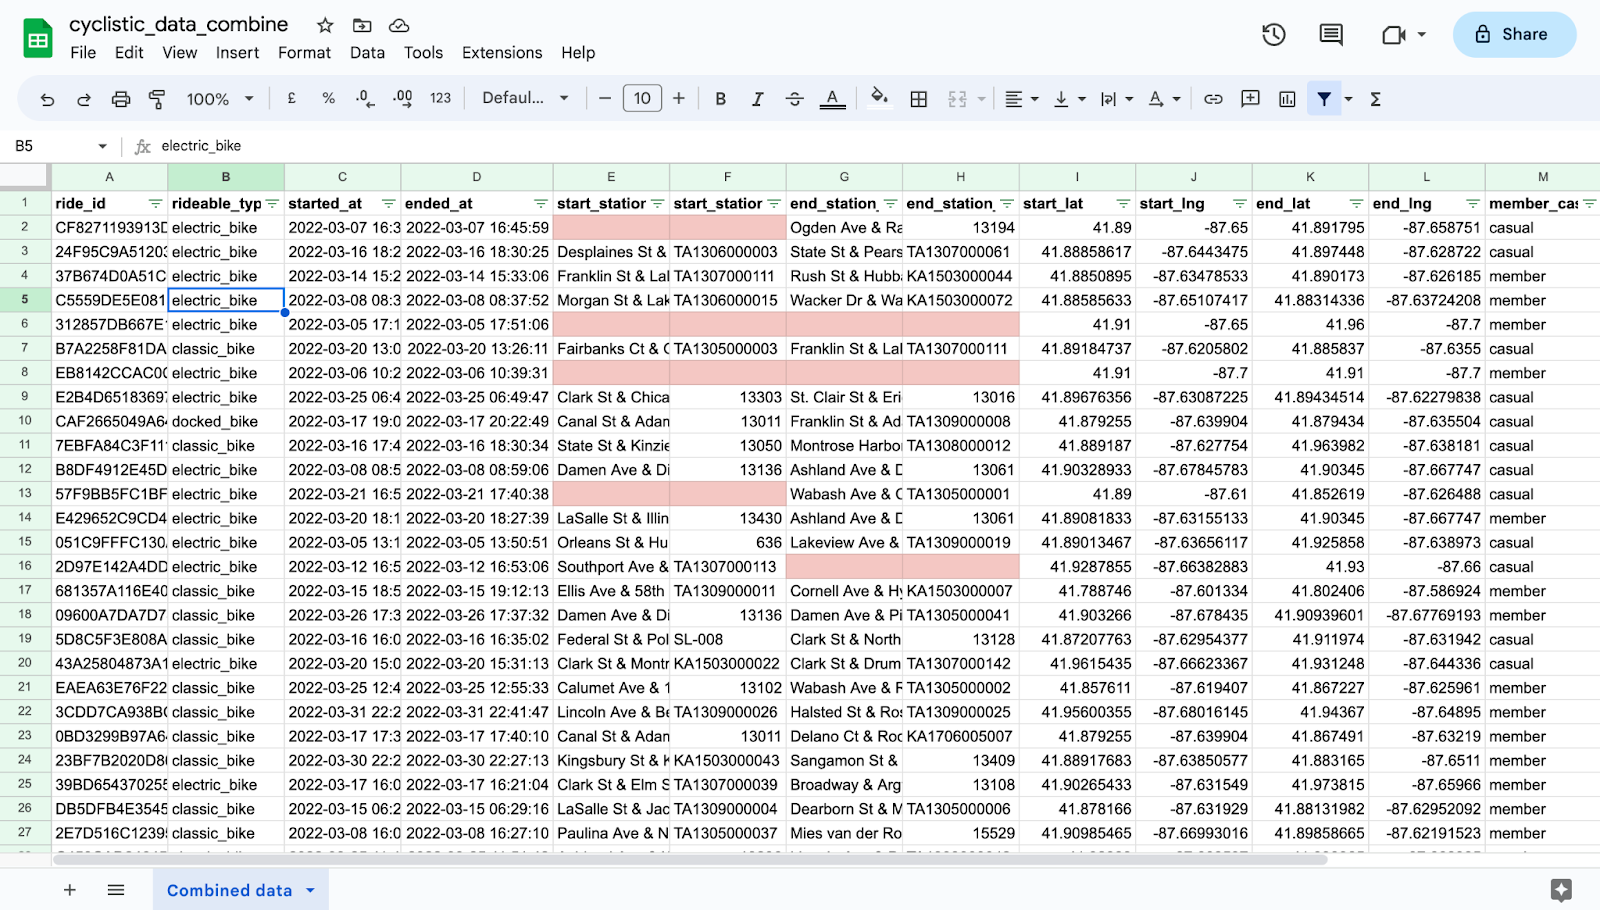
Step 6: Combine all sheets into 1 sheet for seasons and full-year view.
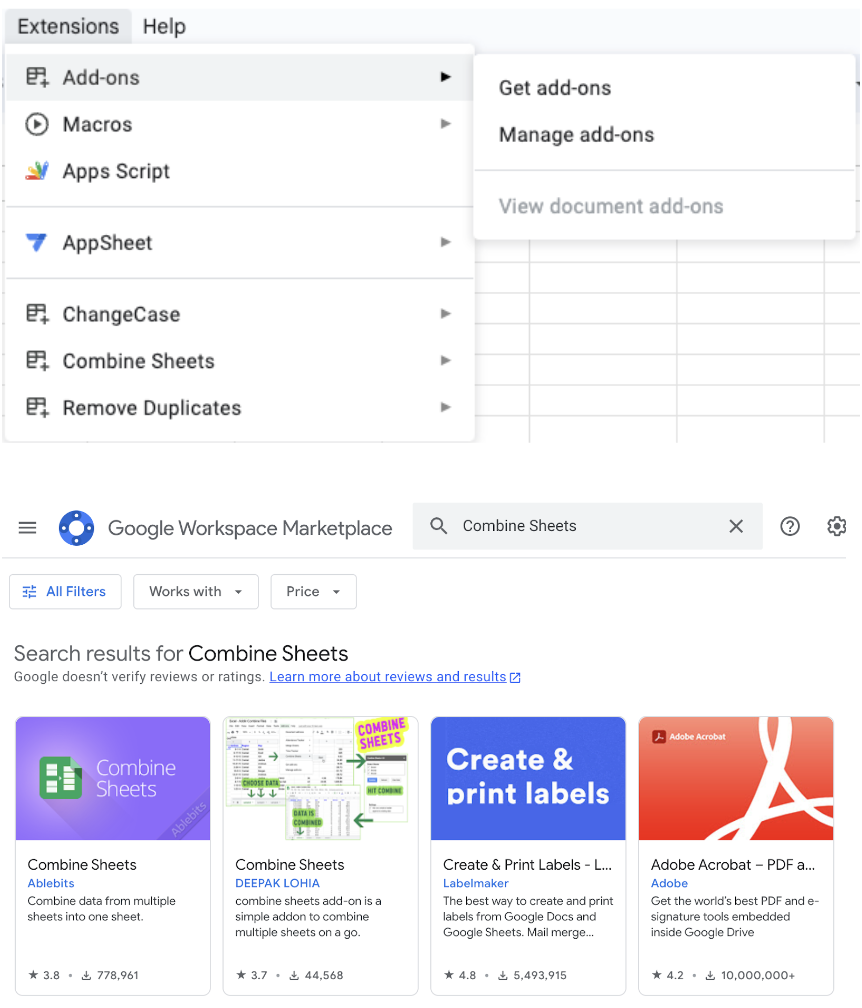
You don't have a direct menu option for this function you need to download the combine sheets add-on from the extensions menu.
Important Note: Combined sheet was too big to clean on a spreadsheet. I went back to the first version and cleaned it. Later I combined all of them.
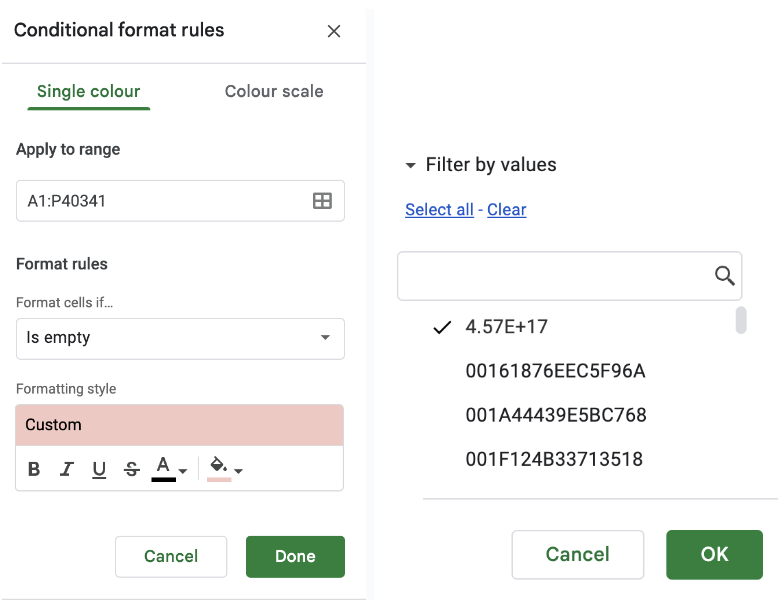
Step 7: Start cleaning the data.
Find blanks using conditional formatting and check irrelevant cells using create filter and clean.
Examples:
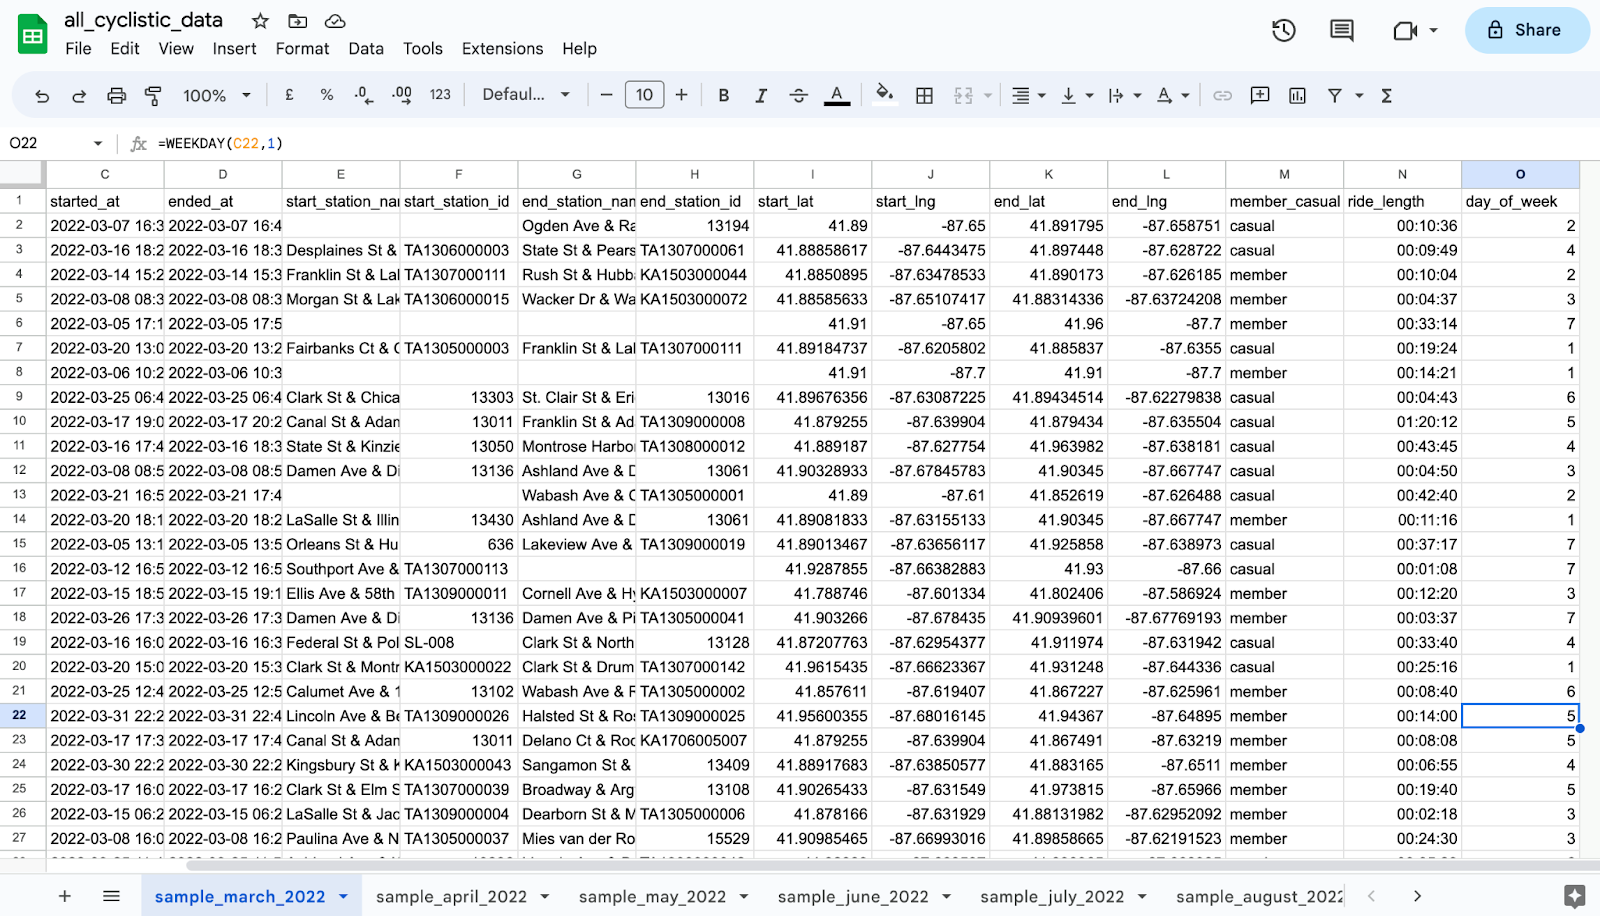
Step 8: Start calculations for a better sense of data.
Add ride_length and day_of_week columns and calculate.
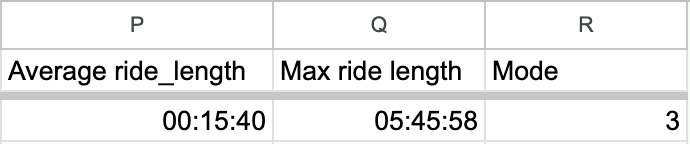
The other formulas but not necessarily:
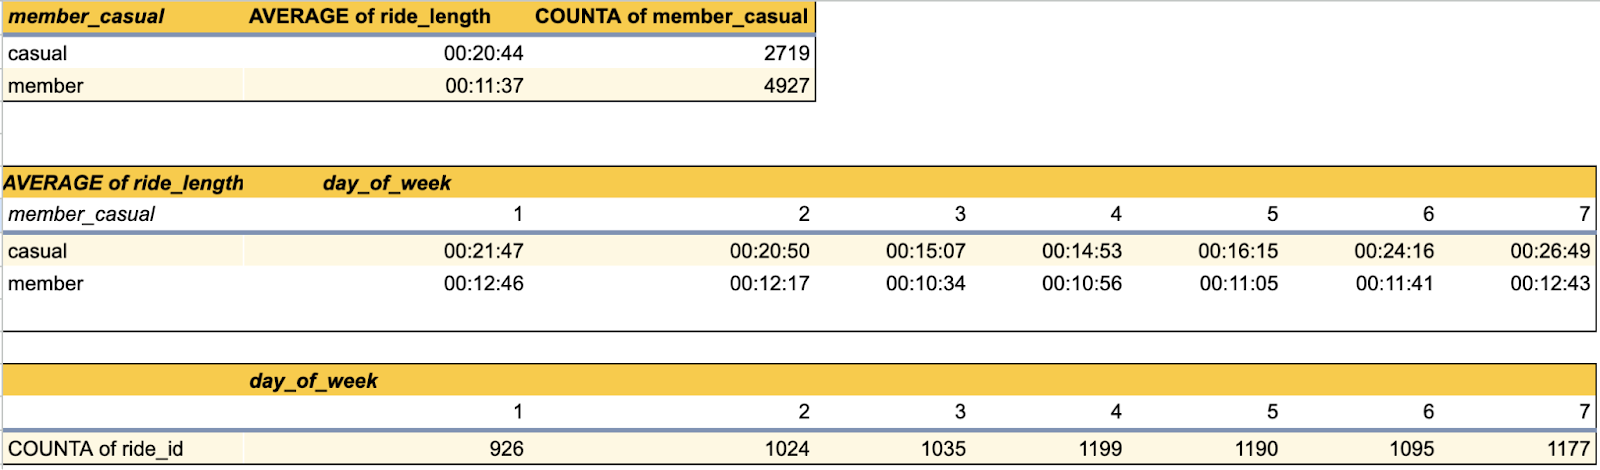
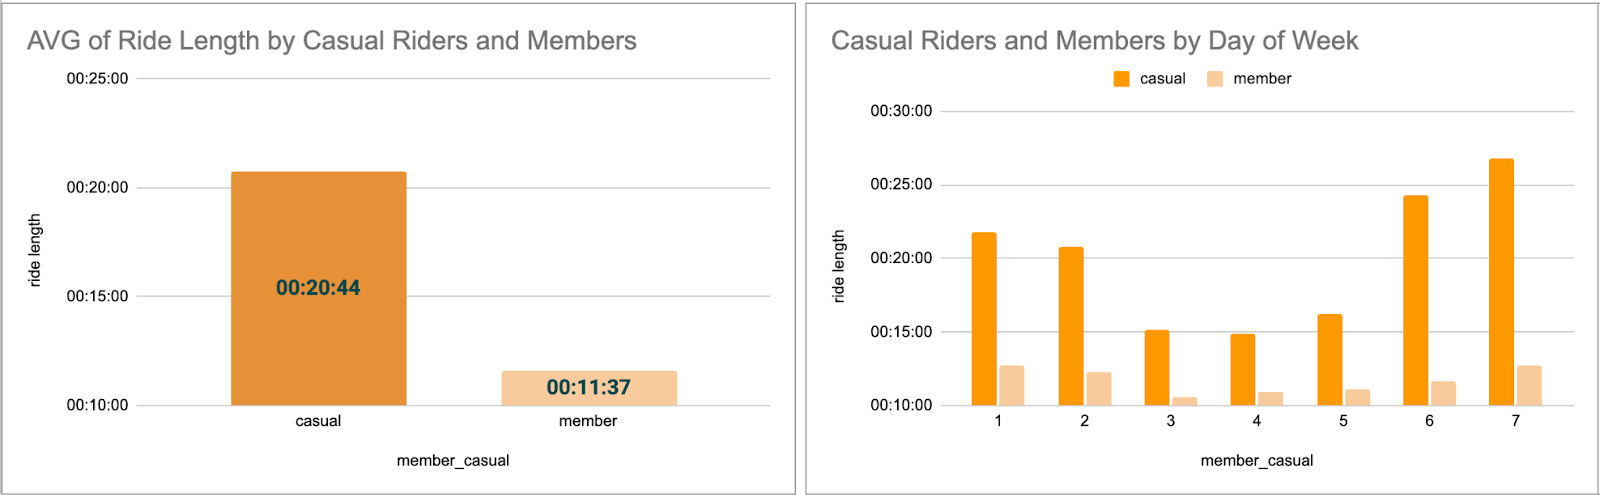
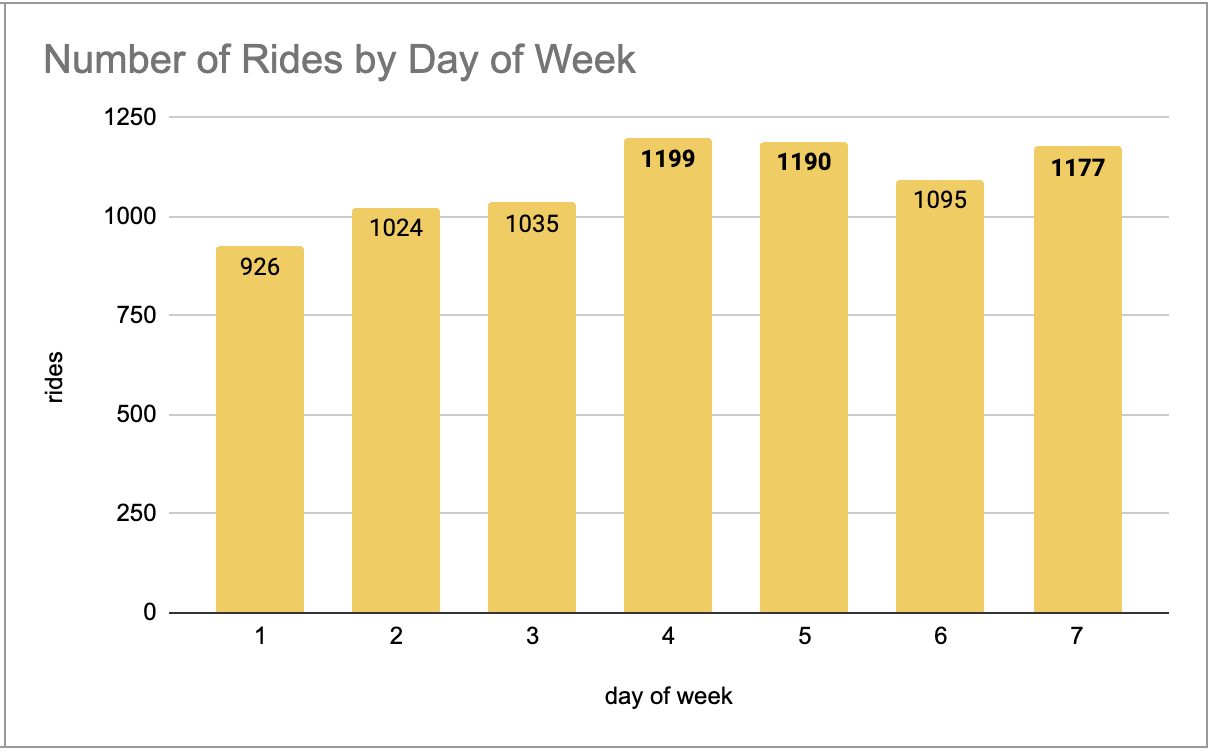
Step 9: Create pivot tables and charts for all seasons and a full-year view.
Example:
Autumn Pivot Tables and Graphs
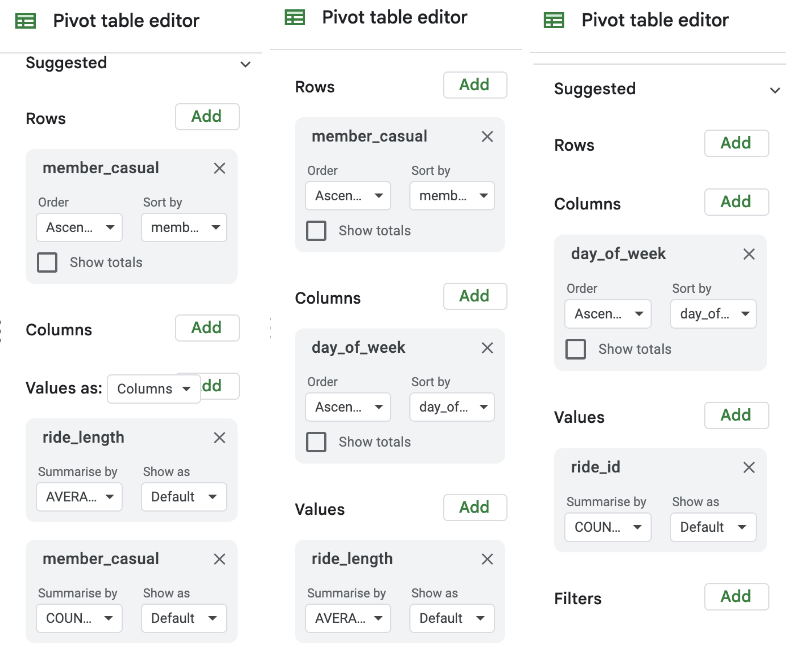
Important Note: Make sure you select the values in the correct order in the pivot table editor.
Step 10: Repeat these steps for all seasons and a full year.
Step 11: Prepare a presentation depending on your analysis.
You can view my presentation here.